Dashboard
The Dashboard is the first screen you see after logging in to the Admin Panel. It gives you a live snapshot of system activity and health without requiring you to dig into individual sections. Accessing the Dashboard requires the dashboard.access permission.
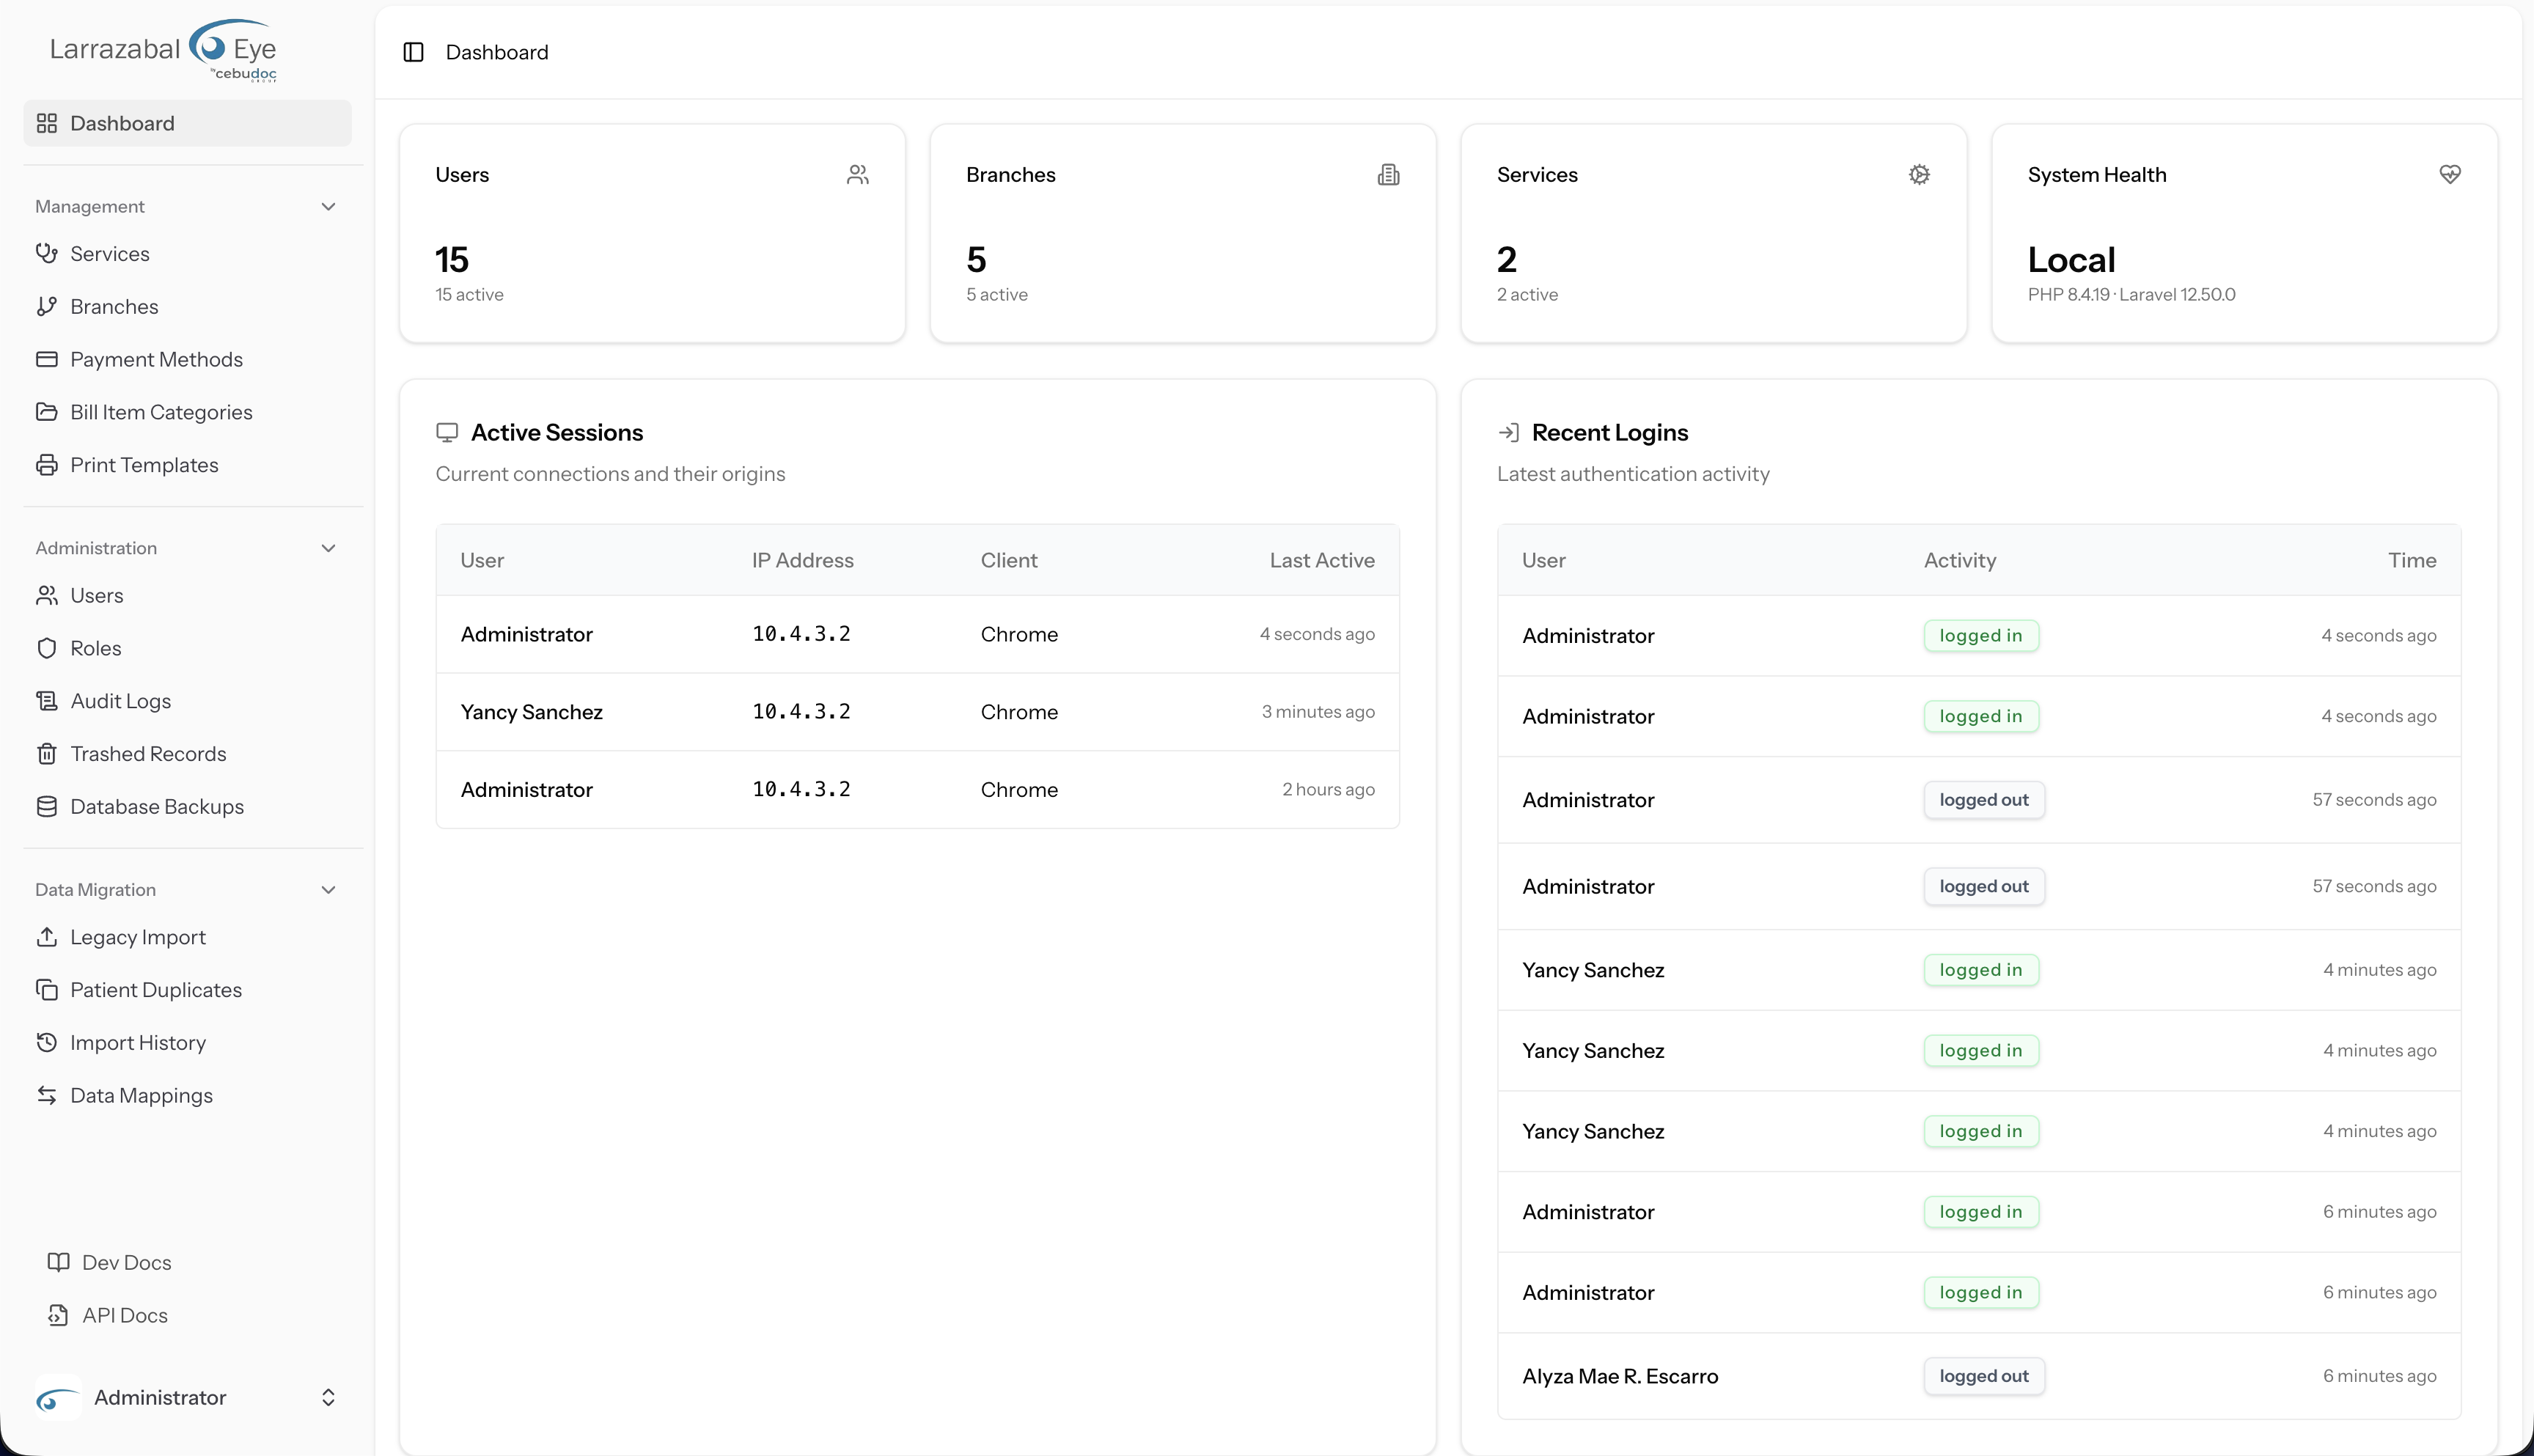
Stat cards
Across the top of the Dashboard is a row of four summary cards.
Users Shows the total number of user accounts in the system as a large bold number, with the count of active accounts as smaller text below it ("n active").
Branches Shows the total number of branches, with the number of active branches below.
Services Shows the total number of services, with the number of active services below.
System Health Shows the current environment name (for example "production" or "local") as the large bold number, with the PHP version and Laravel version as smaller text below it (for example "PHP 8.3.x · Laravel 11.x"). This card is a quick visual indicator that the runtime environment is what you expect.
Active Sessions and Recent Logins
Below the stat cards is a two-column row.
Active Sessions
The Active Sessions card (with the subtitle "Current connections and their origins") lists every session currently open in the application. Each row shows:
| Column | What it shows |
|---|---|
| User | The display name of the logged-in user |
| IP Address | The IP address the session originated from, or a dash if unavailable |
| Client | The user-agent string reported by the browser |
| Last Active | A relative timestamp (for example "5 minutes ago"); hover over it to see the full date and time |
If no sessions are currently open, the table shows "No active sessions."
Recent Logins
The Recent Logins card (subtitle "Latest authentication activity") shows the most recent login and logout events. Each row shows:
| Column | What it shows |
|---|---|
| User | The display name of the user who authenticated, or "Unknown" if the record has no associated user |
| Activity | A badge showing the action: a solid badge for logged in, a muted badge for logged out |
| Time | A relative timestamp; hover to see the full date and time |
If there is no recent authentication activity, the table shows "No recent login activity."
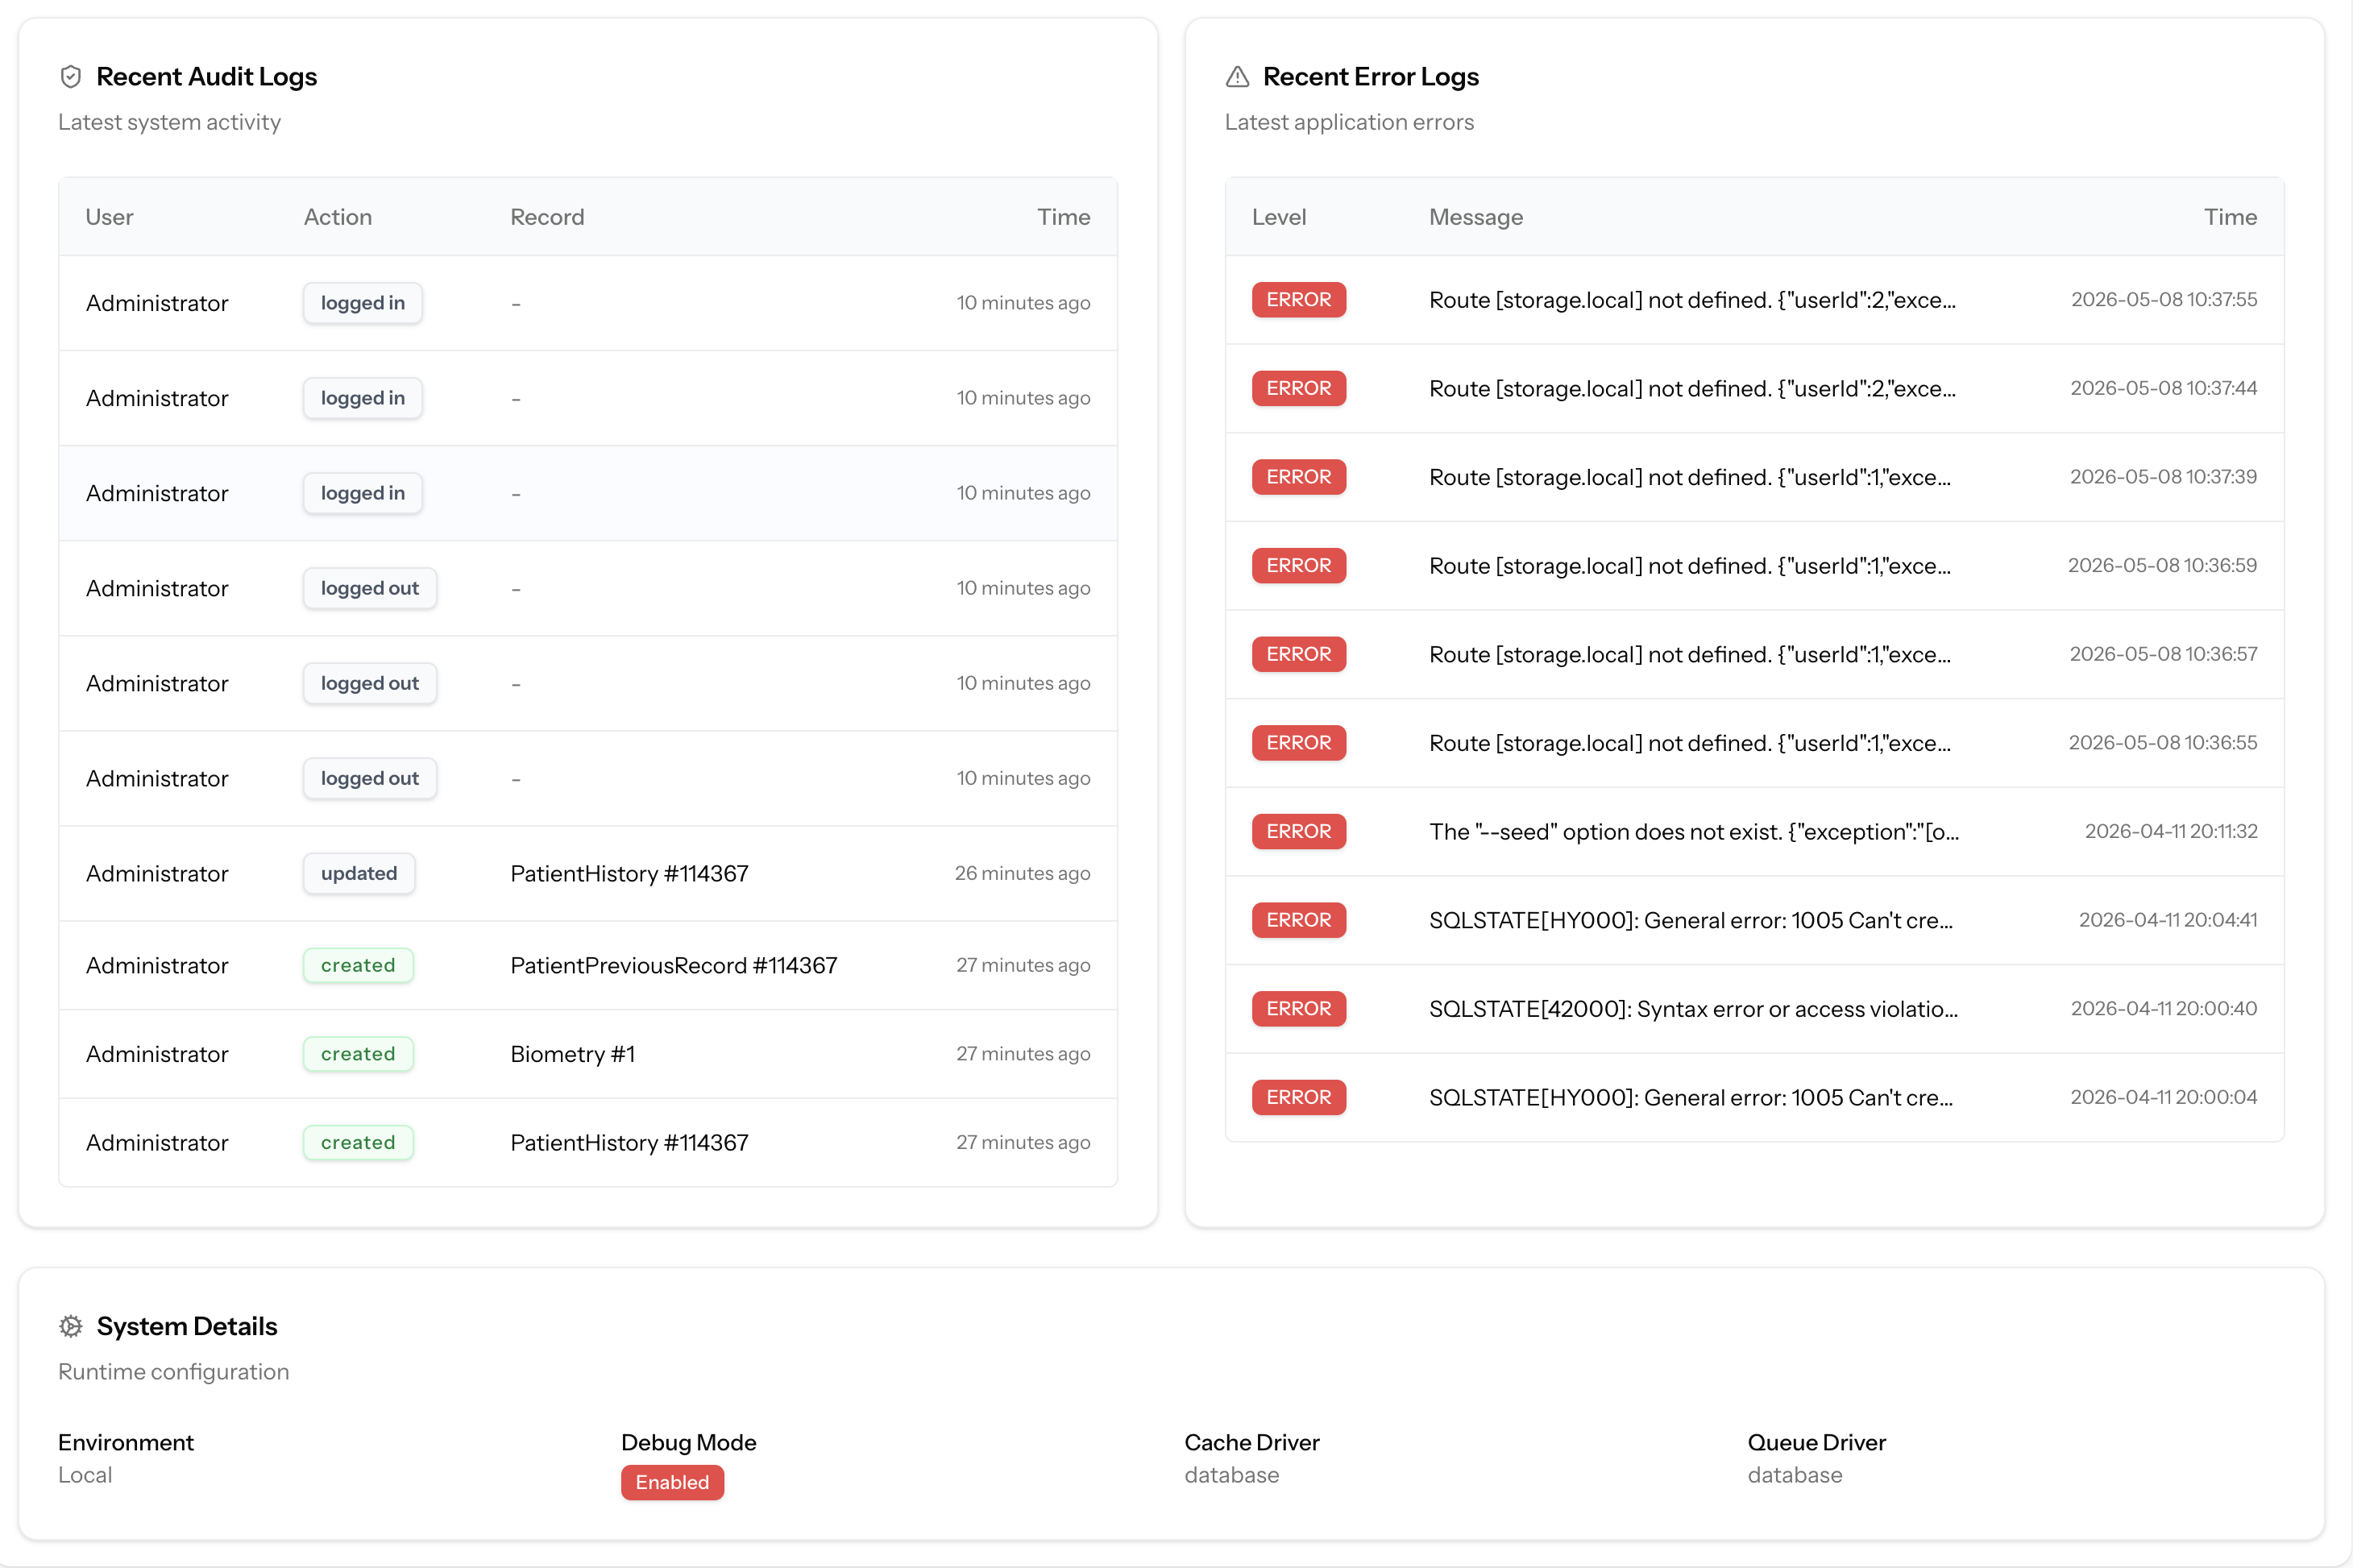
Recent Audit Logs and Recent Error Logs
Below the session row is another two-column row.
Recent Audit Logs
The Recent Audit Logs card (subtitle "Latest system activity") shows the most recent entries from the audit trail. Each row shows:
| Column | What it shows |
|---|---|
| User | The name of the user who performed the action, or "System" for automated events |
| Action | A badge showing the event type: a solid badge for created, a destructive (red) badge for deleted, and a muted badge for all other events (such as updated) |
| Record | The model type and record ID that was affected (for example "Branch #12"), or a dash if no subject was recorded |
| Time | A relative timestamp; hover to see the full date and time |
Click Audit Logs in the sidebar to see the full searchable history. See Audit Logs for details.
If no audit events have been recorded yet, the table shows "No recent audit logs."
Recent Error Logs
The Recent Error Logs card (subtitle "Latest application errors") shows the most recent entries from the Laravel application log. Each row shows:
| Column | What it shows |
|---|---|
| Level | A red destructive badge showing the severity level (for example ERROR or CRITICAL) |
| Message | The error message, truncated if it is longer than the column width. Hover over the cell to see the full message in a tooltip |
| Time | The timestamp of the log entry |
Error log entries are read-only on the Dashboard. If you need to investigate further, access the server logs directly or use your deployment platform's log viewer. If no errors have been logged recently, the table shows "No recent errors."
System Details
At the bottom of the Dashboard is a System Details card (subtitle "Runtime configuration"). It expands on the System Health stat card with four labelled fields arranged in a grid:
| Field | What it shows |
|---|---|
| Environment | The application environment name (for example "production"), shown in lowercase |
| Debug Mode | A badge: red and labelled Enabled when debug mode is on (which should only be the case in development or staging), or muted and labelled Disabled in production. If you see Enabled on a production server, raise it with your system owner immediately |
| Cache Driver | The name of the cache backend configured for the application (for example "redis" or "file") |
| Queue Driver | The name of the queue backend (for example "redis" or "database") |
These values are read-only. Changes to environment configuration require access to the server and are outside the scope of the Admin Panel.